Key data
(in millions of euros)
| 2023 | 2022 | % | ||||
|---|---|---|---|---|---|---|
| Revenue | 249.3 | 229.8 | 8.5% | |||
| EBITDA(1) | 126.2 | 148.4 | (15.0%) | |||
| Net profit attributed to the controlling company | 30.4 | 46.8 | (35.1%) | |||
| Fiscal year dividend | 37.4 | 44.4 | (15.8%) | |||
| Operating cash flow (2) | 189.6 | 130.9 | 44.8% | |||
| Total assets | 1342.8 | 1254.8 | 7.0% | |||
| Equity | 727.9 | 724.3 | 0.5% | |||
| Investments(3) | 119.2 | 87.0 | 37.0% | |||
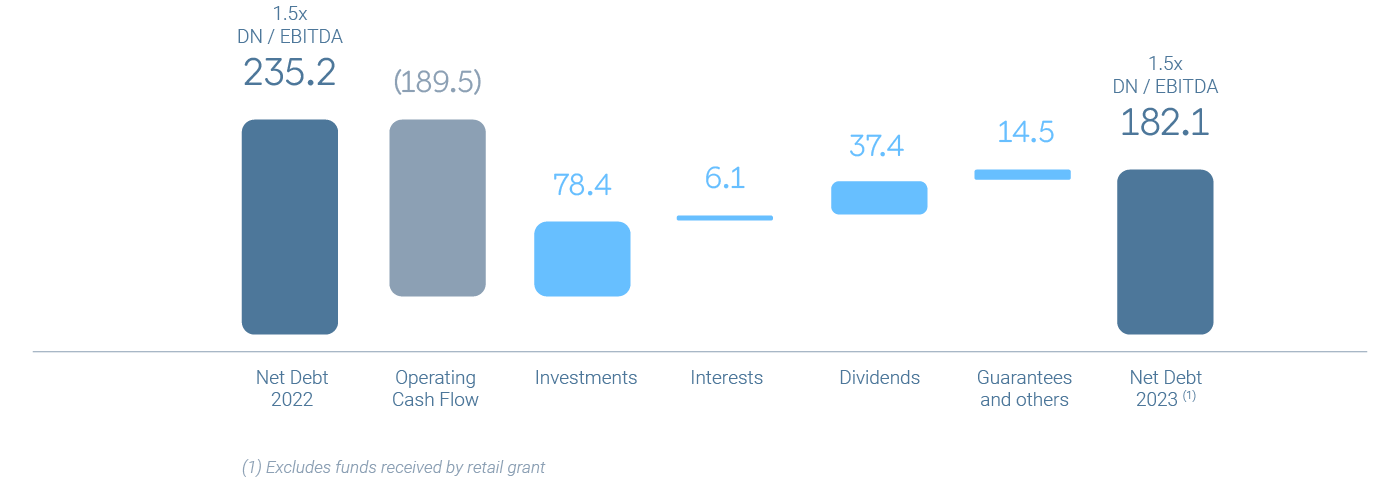
| Net financial debt (4) | 182.1 | 235.2 | (22.6%) | |||
| Leverage(5) | 20% | 24.5% | (18.4%) | |||
| Debt coverage ratio (Net Debt / EBITDA) Covenant | 1.49 | 1.52 | (2.0%) | |||
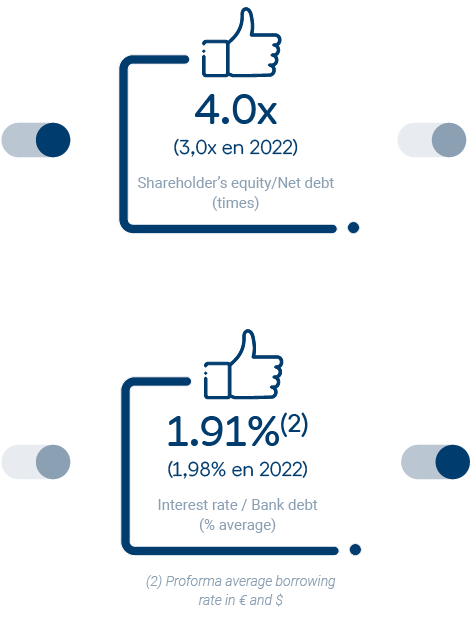
| Solvency ratio (Shareholder’s Equity / Net Debt) Covenant | 3.88 | 2.98 | 30.2% |
(1) Calculated as the operating income of the income statement plus depreciation and impairment.
(2) Cash flows from operating activities less interest payments and receipts)
(3) Cash flows from investing activities by adding other equity instruments. Excludes IFRS 16 payments that are part of the financing cash flow.
(4) Includes valuation of hedging transactions and guarantees in favour of third parties
(5) Calculated as Net Financial Debt divided by Equity plus Net Financial Debt


